The Green Tick Fallacy — Why Batch Observability is Fundamentally Different
How Your Pipelines Fail While Your Dashboards Stay Green
The Green Tick Fallacy
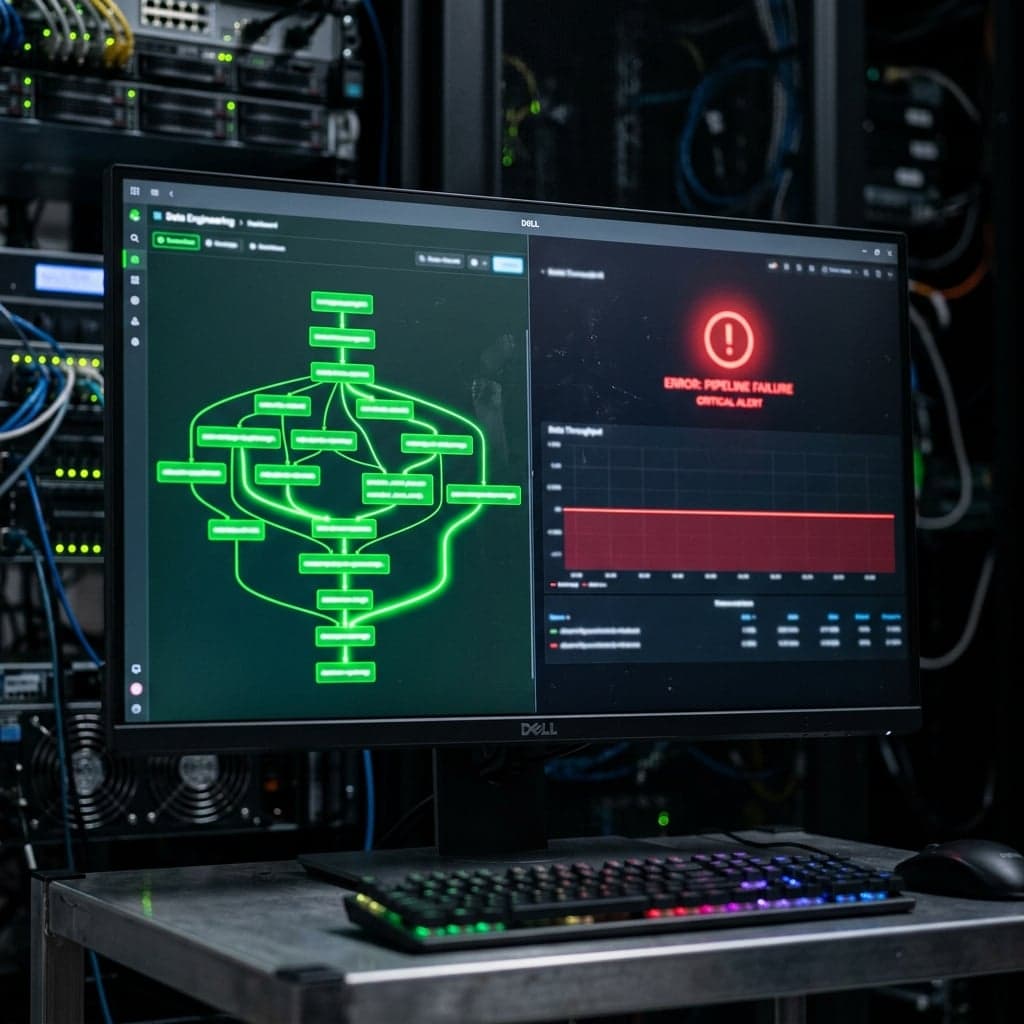
There is a dangerous assumption that every junior data engineer makes: If the Airflow task turns green, the job was successful.
This is the "Green Tick Fallacy." When your Spark job finishes, Airflow checks exactly one thing: did the container return an exit 0 status code? It has absolutely no idea if your job processed 10 billion rows flawlessly, or if it processed 0 rows because an upstream partition was empty. It just knows the container didn't crash.
Relying on the green tick is how you get paged at 3 AM for silent data corruption. To build true batch workload observability, you have to extract internal application metrics — and doing that for batch workloads is fundamentally harder than for services.
Why Batch Observability is Hard
Traditional microservice observability is straightforward. The service runs 24/7, exposing a /metrics HTTP endpoint. Prometheus scrapes it every 15 seconds. The process is always alive to respond.
Batch jobs are ephemeral. They spin up, chew through a terabyte of data in 45 seconds, and vanish. By the time Prometheus tries to scrape them, the process is already dead. You cannot scrape batch jobs — you must push telemetry from inside the code out to an aggregator before the container dies.
This creates a fundamentally different architectural challenge. In the world of services, your observability tool pulls data. In the world of batch, your job pushes data. And the tools designed for pulling don't work cleanly for pushing.
What Observability Actually Means for Batch
Before diving into tools, it's worth defining what "observability" actually means for batch workloads. There are three distinct categories of data you need, and each demands a different architectural approach:
1. Operational Metrics
"Is the system healthy right now?"
How many DAGs ran today?
What's the average task duration?
How many tasks failed in the last hour?
These are low-cardinality, aggregate numbers. You don't need per-run-id granularity. You need rates, counts, and histograms. These are the bread and butter of Prometheus.
2. Task State Snapshots
"What is the current state of this specific task?"
Is task
load_customersin thedaily_etlDAG currently running, failed, or succeeded?What was the duration of this specific execution?
Did the task retry, and what is its final state?
These are point-in-time state snapshots with moderate-to-high cardinality. Each task execution has a unique identity (run_id), and the state may change over the lifecycle (running → failed → retried → success). These can live in Prometheus temporarily, but require careful lifecycle management.
3. Execution History & Audit
"What exactly happened in run XYZ?"
How many rows did
run_id=abc123process?What was the data quality score for this specific schema version?
What was the exact error message and stack trace?
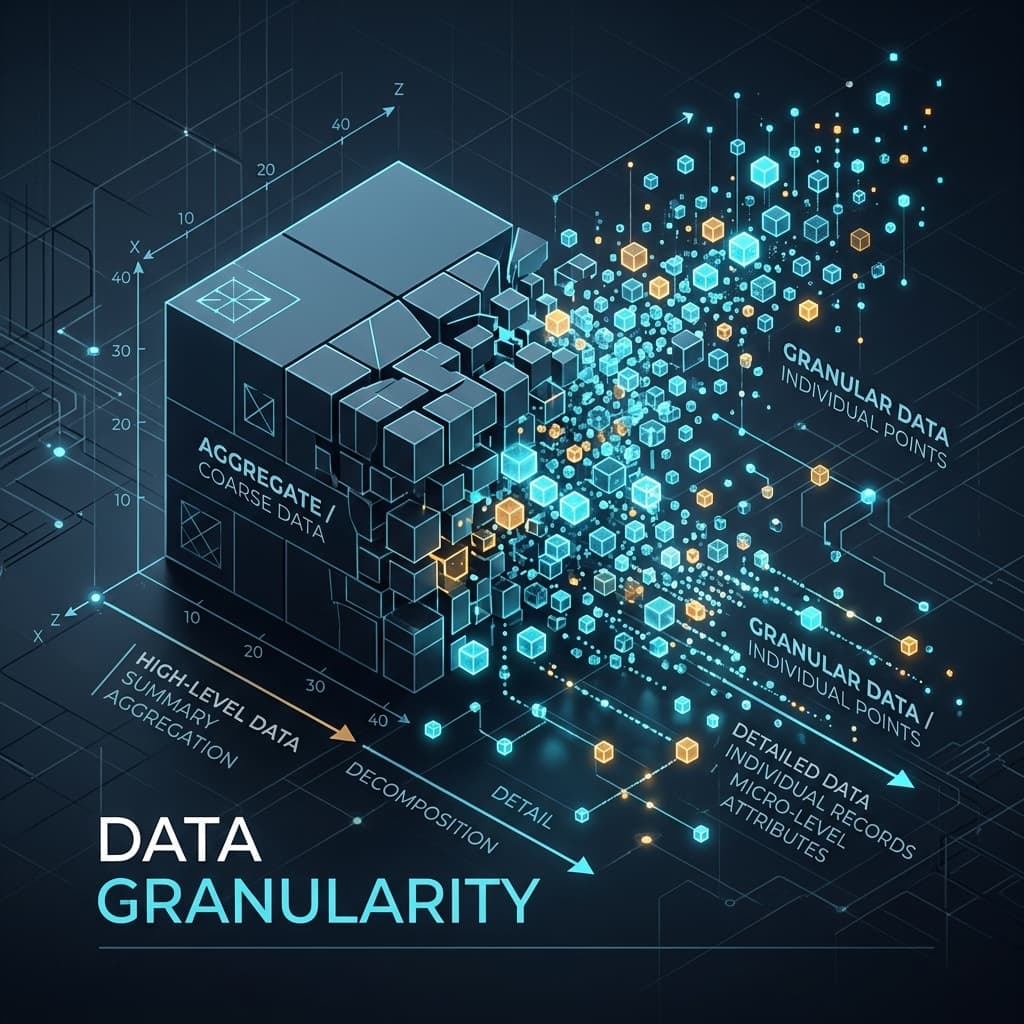
This is high-cardinality, per-execution, durable data. It must be queryable weeks or months later for debugging, reconciliation, and compliance. This data does not belong in Prometheus.
The Trap: Forcing Everything into One Tool
The mistake most teams make is trying to force all three categories into a single observability system — usually Prometheus via the Pushgateway. This leads to:
Pushgateway abuse: Pushing per-
run_idmetrics to Prometheus via Pushgateway, creating unbounded cardinalityOOM crashes: Pushgateway has no native TTL, so dynamically labelled metrics accumulate in memory forever
Semantic mismatches: Using the wrong metric type (Counters where Gauges belong), leading to inflated or incorrect dashboard numbers when tasks retry
In this series, we'll build a clean architecture that uses the right tool for each category. We'll show you exactly how to set up the stack, what code to write, and what traps to avoid.
What's Coming in This Series
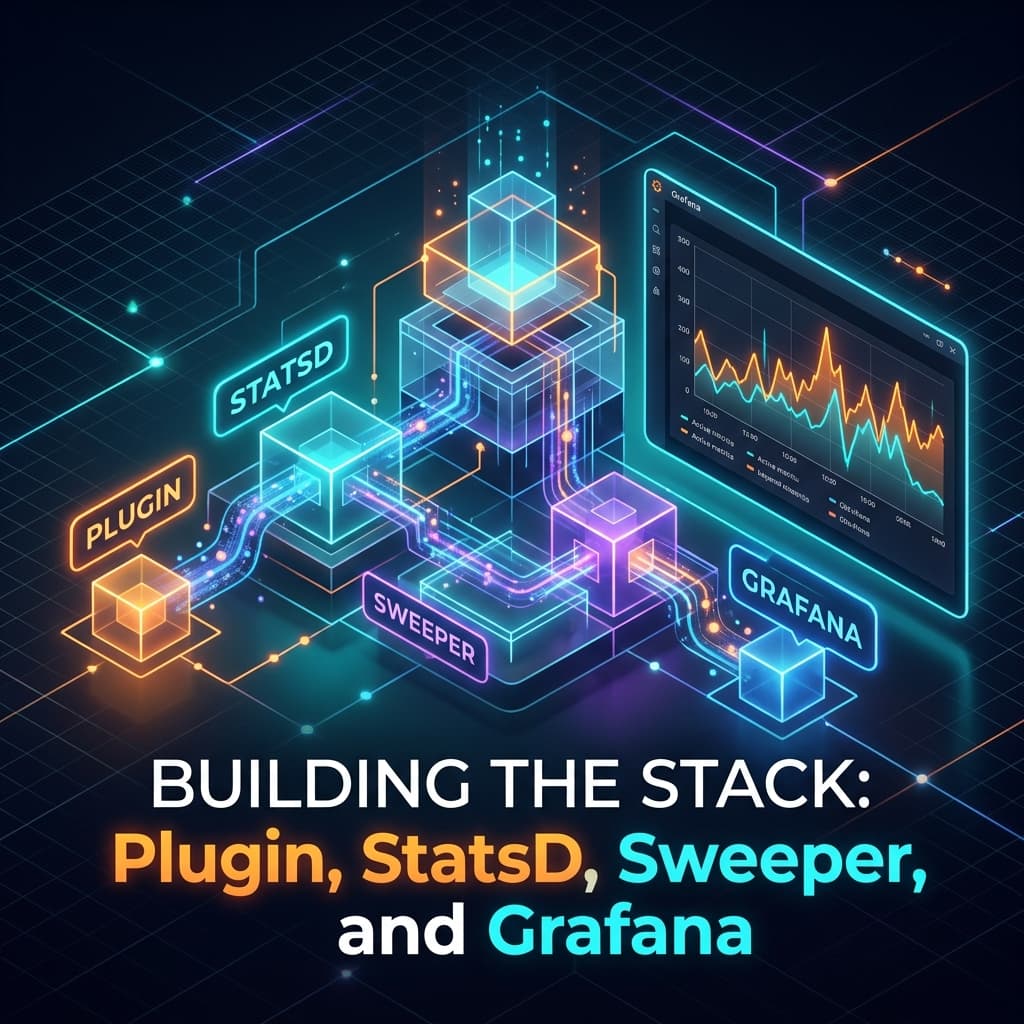
Part 2: The Architecture — How to design a Prometheus + Grafana + StatsD architecture for batch workloads. What belongs in Prometheus, what doesn't, and where StatsD fits.
Part 3: Metric Granularity & Classification — What level of observability to achieve where. Why Gauges are semantically correct for batch state (and why it's NOT about performance). What data belongs in Prometheus vs. structured logs and OLAP stores for auditing and traceability.
Part 4: The Implementation — Building a production-ready Airflow plugin with Gauges, configuring StatsD, designing a Sweeper DAG, and setting up Grafana dashboards. Complete code walkthrough.
Part 5: Future Scope — How to build durable, per-execution audit trails using event streams, OLAP stores, distributed tracing, and data lineage for the data that should never touch Prometheus.
Key Takeaways
For Juniors: The green tick lies.
exit 0means the container didn't crash, not that it processed data correctly. You must push application metrics out of your batch jobs.For Seniors: Batch observability has three distinct data categories (operational metrics, state snapshots, execution history). Forcing all three into Prometheus is a common and expensive mistake.
The Rule: Match your data to the right storage backend. Not everything belongs in a time-series database.