The Architecture — Prometheus, Grafana, and StatsD for Batch Workloads
Master the Airflow Prometheus StatsD architecture for batch workloads. Eliminate race conditions and cardinality explosions with push-based telemetry.

(This is Part 2 of the Batch Workloads Observability series. Read Part 1: The Green Tick Fallacy first for context.)

The Default Choice: Prometheus
When engineering teams realise they need to extract internal application metrics from their batch pipelines (to escape the "Green Tick Fallacy"), they inevitably reach for Prometheus.
It makes perfect sense. Prometheus is the industry standard. Grafana integrates beautifully with it. PromQL is incredibly powerful. Your infrastructure team already has it running. (If you want a detailed breakdown of each component and how the standard Prometheus architecture works under the hood, check out this comprehensive guide by DevOpsCube.)
But there is a fundamental mismatch: Prometheus is a pull-based system. It expects to scrape a /metrics HTTP endpoint exposed by a continuously running service.
Batch jobs, however, are ephemeral. A Spark job might spin up, process terabytes of data in 45 seconds, and vanish. By the time the Prometheus scraper comes around (typically every 15 to 30 seconds), the container is already dead. You cannot scrape batch jobs—you must push telemetry out before the container dies.
The Push Problem & The Proxy
To solve the push-vs-pull mismatch, the standard architecture introduces the Prometheus Pushgateway.
The idea is simple: it acts as a middleman. Your ephemeral batch job pushes its metrics to the Pushgateway via HTTP just before exiting. The Pushgateway caches those metrics in memory. Prometheus then continuously scrapes the Pushgateway at its own pace.
Problem solved, right? Not quite. This is where most batch observability architectures begin to rot. To understand why, we have to talk about dimensions.
Understanding Dimensions and Cardinality
In Prometheus, data isn't just stored as a flat list of numbers. It's stored as Time Series, defined by a metric name and a set of key-value pairs called labels (or dimensions).
For example, a task failure metric might look like this: airflow_task_status{dag_id="daily_etl", task_id="load_users", status="failed"}
Every unique combination of labels creates a brand new time series in the database. The total number of unique time series is called cardinality.
Low-Cardinality Labels:
dag_id(maybe 50 total),task_id(maybe 200 total),status(success, failed, running). These are bounded. They are safe.High-Cardinality Labels:
run_id(a unique UUID for every single execution),user_id, orerror_message. These are unbounded. They grow infinitely.
When monitoring a batch workload, you naturally want to know: Which DAG? Which task? Which specific run? How many rows did it process? So, engineers intuitively add a run_id label to their Pushgateway metrics.
The Dumb Proxy and The Race Condition
If you don't use a unique label like run_id, you hit an immediate wall.

The Pushgateway is essentially a dumb proxy. It doesn't aggregate metrics, it doesn't add numbers together, and it doesn't deduplicate. It simply acts as a key-value store. The "key" is the combination of your labels (the grouping key).
If ten parallel Airflow tasks fail at the exact same millisecond, and they all push failure_count = 1 to the Pushgateway without a run_id, they all write to the exact same key. The Pushgateway just overwrites the value ten times. Prometheus scrapes it once and sees: failure_count = 1. You just lost nine failure records.
This is a race condition. Parallel tasks overwrite each other because they share the same grouping key.
The Fatal Fix: Fighting Prometheus
The "obvious" fix is to add run_id to the grouping key. Because every run has a unique ID, every task gets its own isolated slot in the Pushgateway. The race condition is solved!
But you've just created a ticking time bomb.
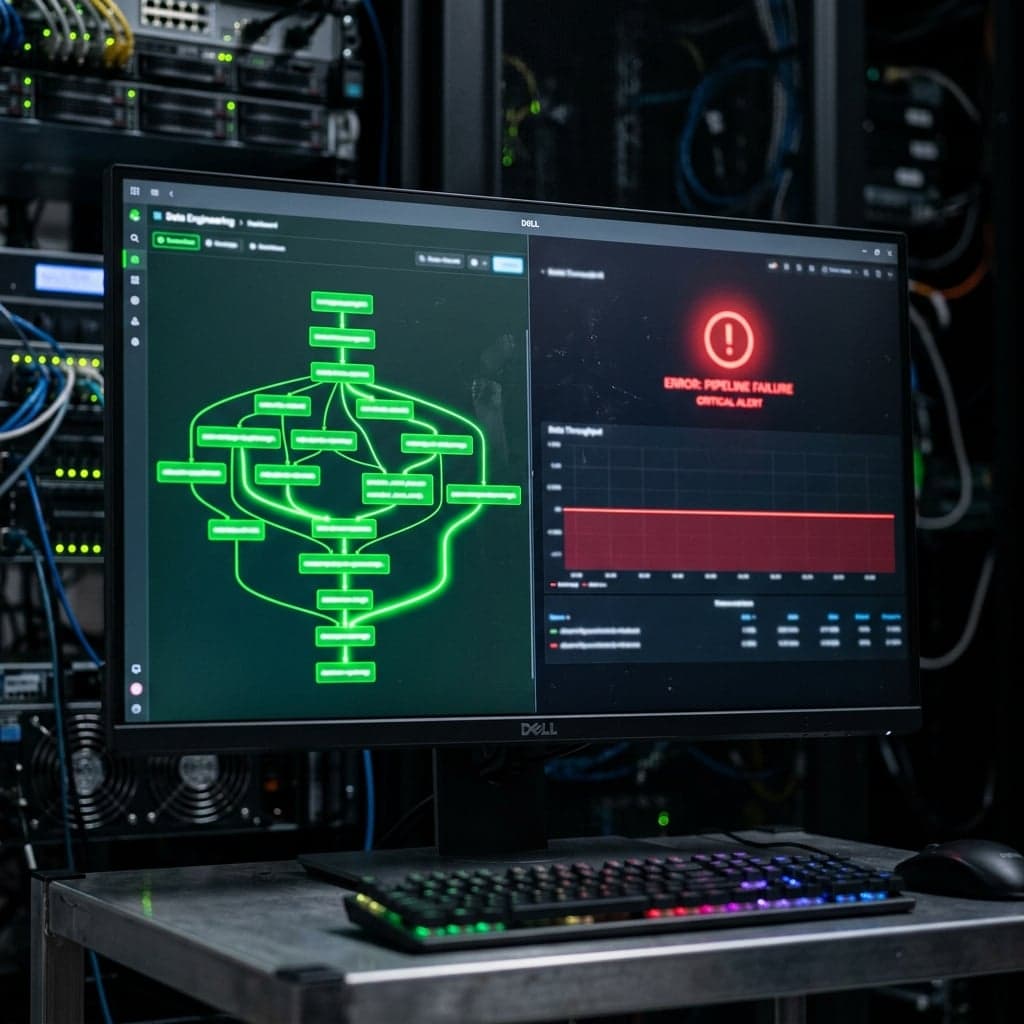
By adding run_id, you have introduced unbounded cardinality. Every single task execution creates a brand new time series. Furthermore, the Pushgateway has no native TTL (Time To Live). It holds every metric group in memory forever.
Within a few days of high-volume DAG runs, the Pushgateway's memory balloons until the container OOM (Out of Memory) crashes. When Prometheus tries to scrape it, the massive payload crashes the scraper.
This happens because teams misunderstand what Prometheus is. Prometheus is designed for low-cardinality, continuous metrics. It is not designed to store high-cardinality, event-based data. When you push per-run execution data into Prometheus, you are treating a time-series database like an event log.
The Realization: Two Different Problems
The breakthrough happens when you realize that "batch observability" isn't a single problem. You are actually trying to answer two completely different questions:
Operational Metrics: "Is the system healthy right now? What is the overall failure rate?" (Needs aggregation, low-cardinality).
State Snapshots: "What is the current status of this specific task run?" (Needs per-run isolation, high-cardinality).
Trying to force both of these through the Pushgateway is the core architectural mistake. We need two different data paths.
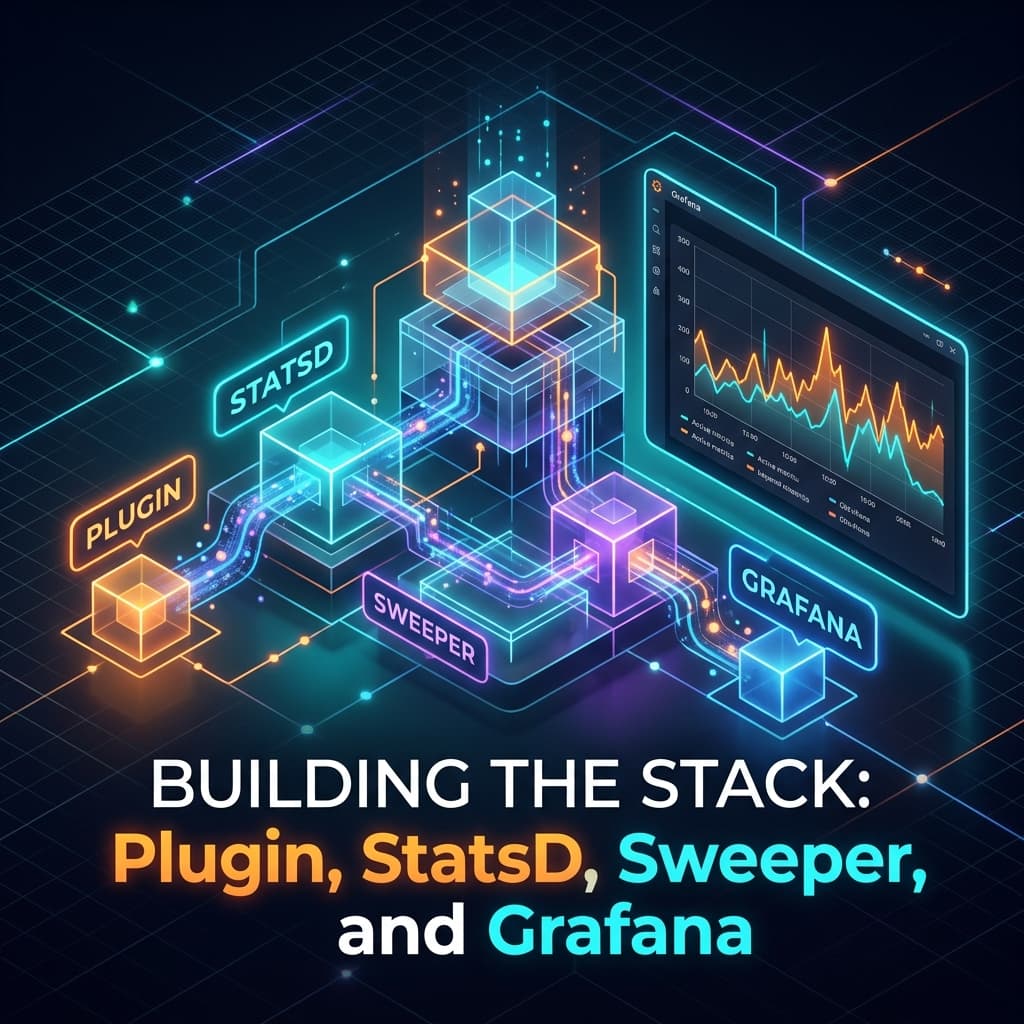
The Architecture Stack
Here is the robust, Staff-level architecture we use to solve this cleanly:
Prometheus: Time-series database — stores aggregated operational metrics and temporary task state snapshots.
Grafana: Dashboarding and alerting — visualizes metrics from Prometheus.
StatsD Exporter: The missing link — catches high-frequency UDP bursts, aggregates them, and safely exposes them to Prometheus.
Pushgateway: Push-based ingestion — restricted only to temporary state snapshots.
Sweeper DAG: Automated cleanup — deletes stale Pushgateway metric groups to prevent OOM crashes.
Path 1: Operational Metrics via StatsD
Airflow Task → UDP packet → StatsD Exporter → Prometheus scrape → Grafana
StatsD solves the race condition at the network layer. It listens over UDP. When 10 tasks fire airflow.task.failed:1|c at the exact same millisecond, StatsD catches all 10 packets in memory, adds them up, and flushes a single aggregated metric (failure_count = 10) to Prometheus.
No unique identifiers (run_id) are needed. No race conditions. Zero cardinality explosion. Best of all, Airflow has StatsD support built into its core—you just have to enable it.
Path 2: Task State Snapshots via Pushgateway
Airflow Plugin → HTTP POST → Pushgateway → Prometheus scrape → Grafana
StatsD is perfect for counts, but it can't answer: "What is the current state of task X in run Y?"
For per-task state visibility at a small-to-medium scale, we do use the Pushgateway, and we do use run_id as a grouping key. However, we apply strict lifecycle management. We deploy an Airflow Sweeper DAG that runs on a schedule, queries the Pushgateway REST API, and deletes metric groups older than a configured threshold.

This prevents OOM crashes while giving us exactly enough runway to monitor active DAGs.
The Architectural Boundary: It is critical to understand that this Pushgateway approach is a stepping stone. At a truly massive scale (tens of thousands of tasks per hour), Prometheus ingestion will still choke on the cardinality, and the Sweeper DAG itself becomes a bottleneck. For large-scale environments, you must abandon Prometheus for per-run tracking entirely and push task events to a dedicated event log system (like Elasticsearch, Grafana Loki, or ClickHouse).
Key Takeaways
Prometheus is not an event log: It is built for low-cardinality, continuous metrics. Do not use it for durable, per-run audit trails.
The Pushgateway is a dumb proxy: Pushing concurrent metrics without unique keys causes race conditions. Adding unique keys causes OOM crashes.
StatsD is the missing link: It aggregates concurrent events at the network layer, completely eliminating race conditions and cardinality bloat for operational metrics.
Scale dictates your state architecture: Use the Pushgateway + Sweeper DAG for medium-scale task state snapshots. For massive scale, move per-run state tracking entirely to an event logging system like Elasticsearch or Loki.